
Data alignment
Problem
Sometimes you have different data sources on different time grids. And when you place them on a single timeline, data alignment artifacts appear. As example:
Source 1: [
    timestamps: [1, 20, 30],
    values:     [1, 1,  1],
]

Source 2: [
    timestamps: [0, 15, 30, 45],
    values:     [2, 2,  2,  2],
]
Produces:
{
    timeline: [0, 1, 15, 20, 30, 45],
    series: [{
        name: 'Source 1',
        data: [x, 1, x,  1,  1,  x]
    }, {
        name: 'Source 2',
        data: [2, x, 2,  x,  2,  2]
    }]
}
In this example, we marked all the artifacts with an x. By default, uPlot can handle inputs like that if we replace the x with undefined and set spanGaps = true in the series options. But there are problems with stacked areas and columns and other transformations like normalization. As example: by definition stacks are stacked sum of all Y-values on the given X-point, but if some Y-value is missing it becomes undefined to correctly calculate the sum.
Solution
Yagr has a solution. If you're seeing data alignment artifacts, you can set up processing options:
timeline: [1, 2, 3],
series: [{
    name: 'Source 2',
    data: [1, 'x', 3],
}],
processing: {
    interpolation: {
        value: 'x',
        type: 'linear'
    }
}
This will produce a chart where the data set [1, 'x', 3] will be rendered as [1, 2, 3] by linear interpolation of the initial value 'x'.
-
yagr.config.processingfor data transformations before generating options and rendering. If this section is empty, Yagr skips the processing stage
Null values
nullValues: Record<string, string | null>
This is a map of string values Yagr will replace with null in the resulting series while show the given string value (or null) in a tooltip. For instance, showing Infinity values of asymptotic growth can be useful:
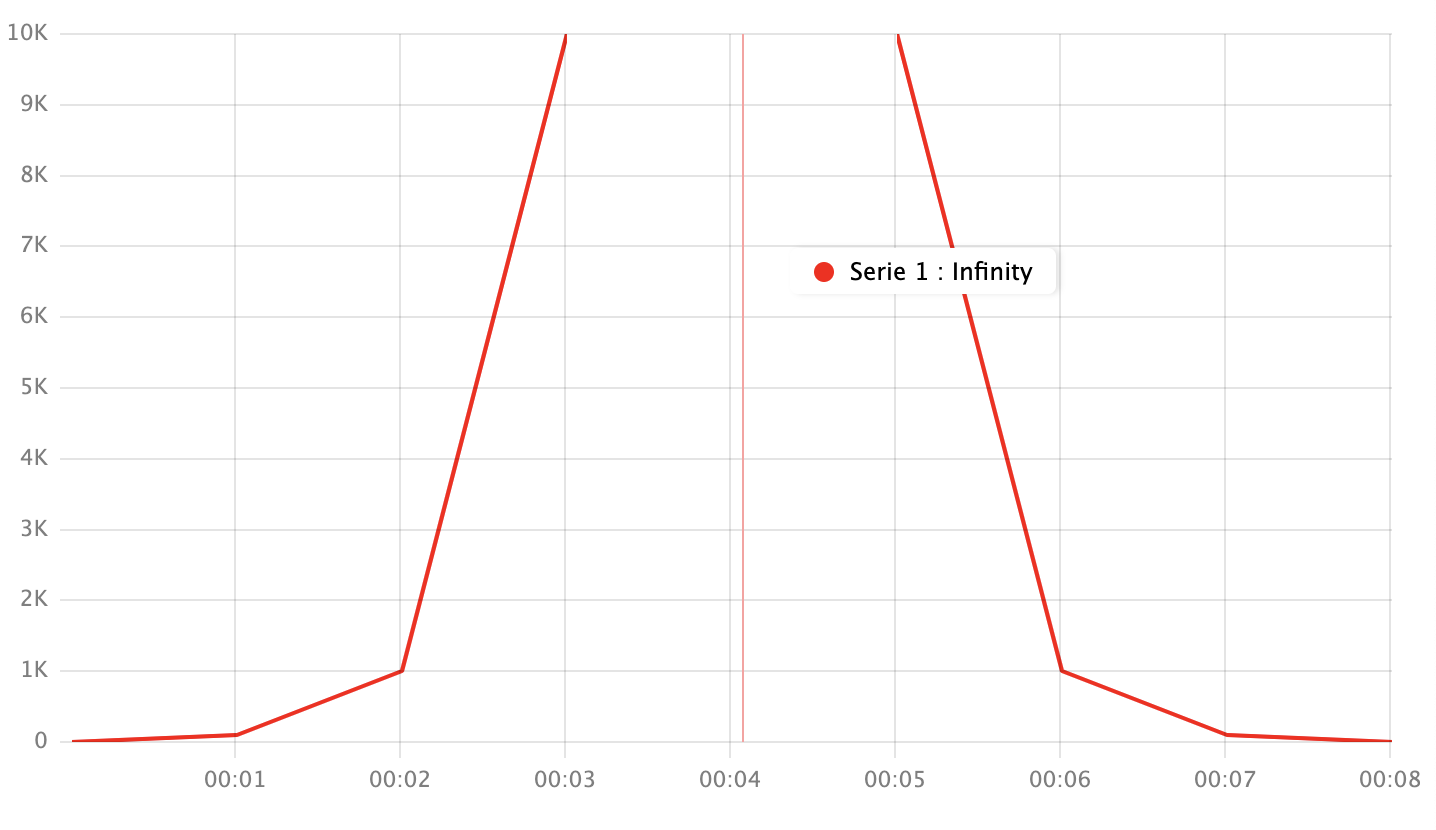
Config:
module.exports = {
    timeline: [1000, 2000, 3000, 4000, 5000, 6000, 7000, 8000, 9000],
    series: [{
        "data": [1, 100, 1000, 10000, '+inf', 10000, 1000, 100, 1],
        "color": "red"
    }],
    processing: {
        nullValues: {
            '+inf': 'Infinity'
        }
    },
}
Data Interpolation
Interpolation options define how to transform data alignment artifacts.
Interpolation
interpolation.value- the value in seriesdatafield that will been replaced with an interpolated value.interpolation.type- the type of interpolation. Examples are given for dataset:
['x', 2, 'x', 'x', 4, 'x'];
-
linear- use simple linear interpolation between two points.

-
left- take the previous point's value if the given point is not the last one

-
previous- take the previous point's value

-
right- take the next point's value if the given point is not the first one
-
next- take the next point's value

-
closest- take the closest point's value

-
<your value>- replace the value with your own
-
interpolation.snapToValues?: SnapToValues | false- option to define which values take for missing data. See cursor value snapping