
Cursor
Yagr lets you set up cursor behavior for charts. You can configure crosshairs, the number and size of markers, and snapping behavior.
Configuration
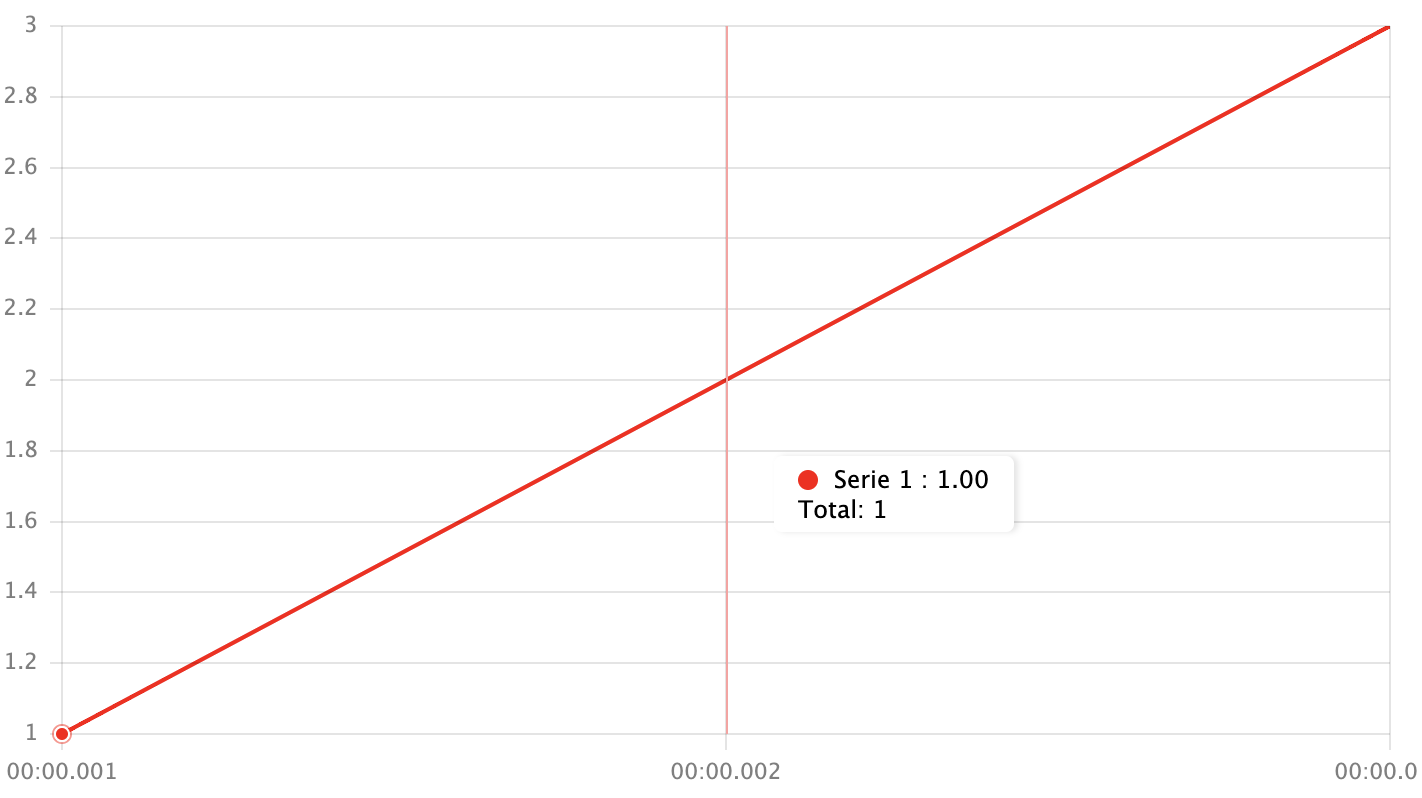
Value snapping
cursor.snapToValues?: SnapToValue | false
type SnapToValue = 'left' | 'right' | 'closest';
Snapping to values lets you only render markers on existing points on a timeline. If the cursor points to value X, where Y is null with snapToValues, you can configure which real point to highlight with a marker.
-
'left'- find the nearest non-null value to the left
-
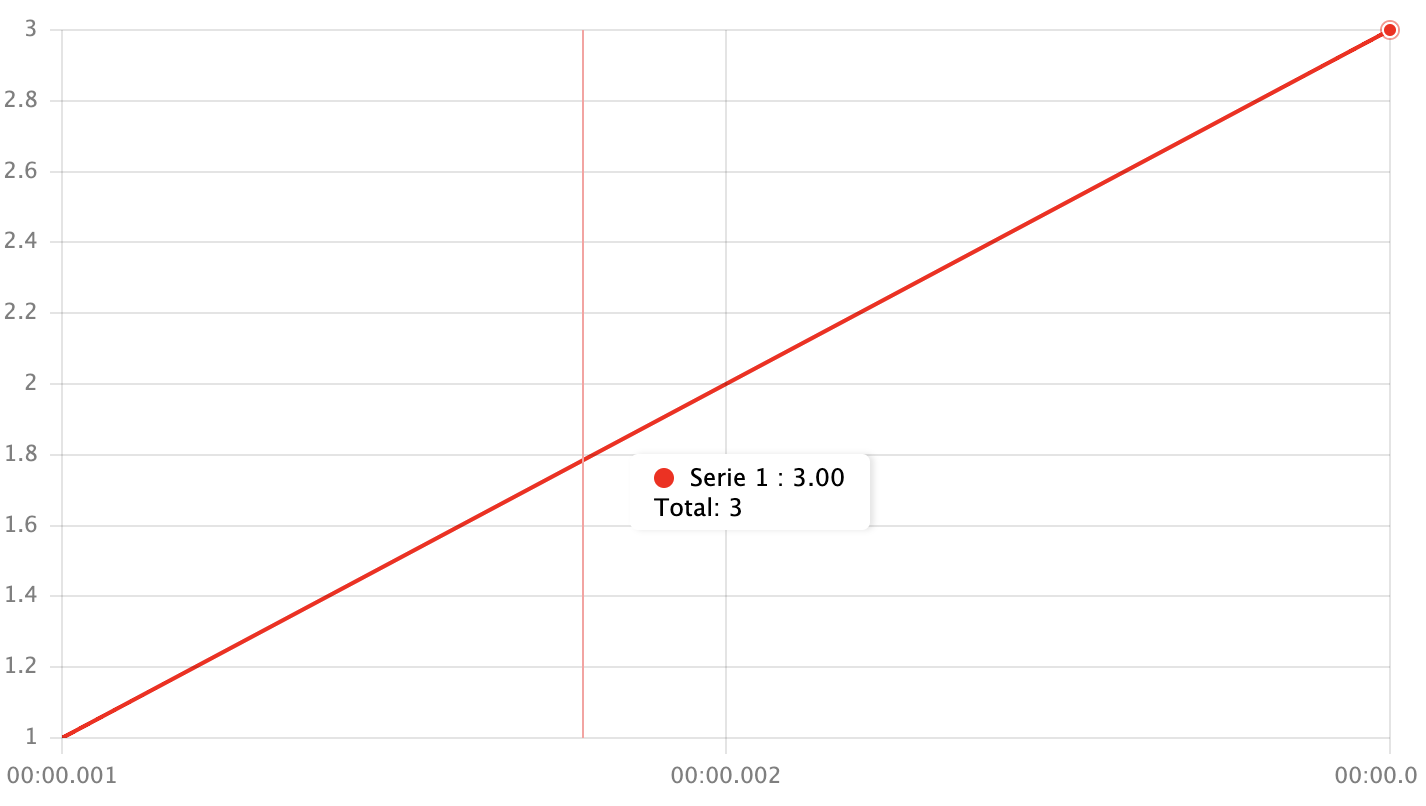
'right'- find the nearest non-null value to the right
-
'closest'- find the nearest non-null value -
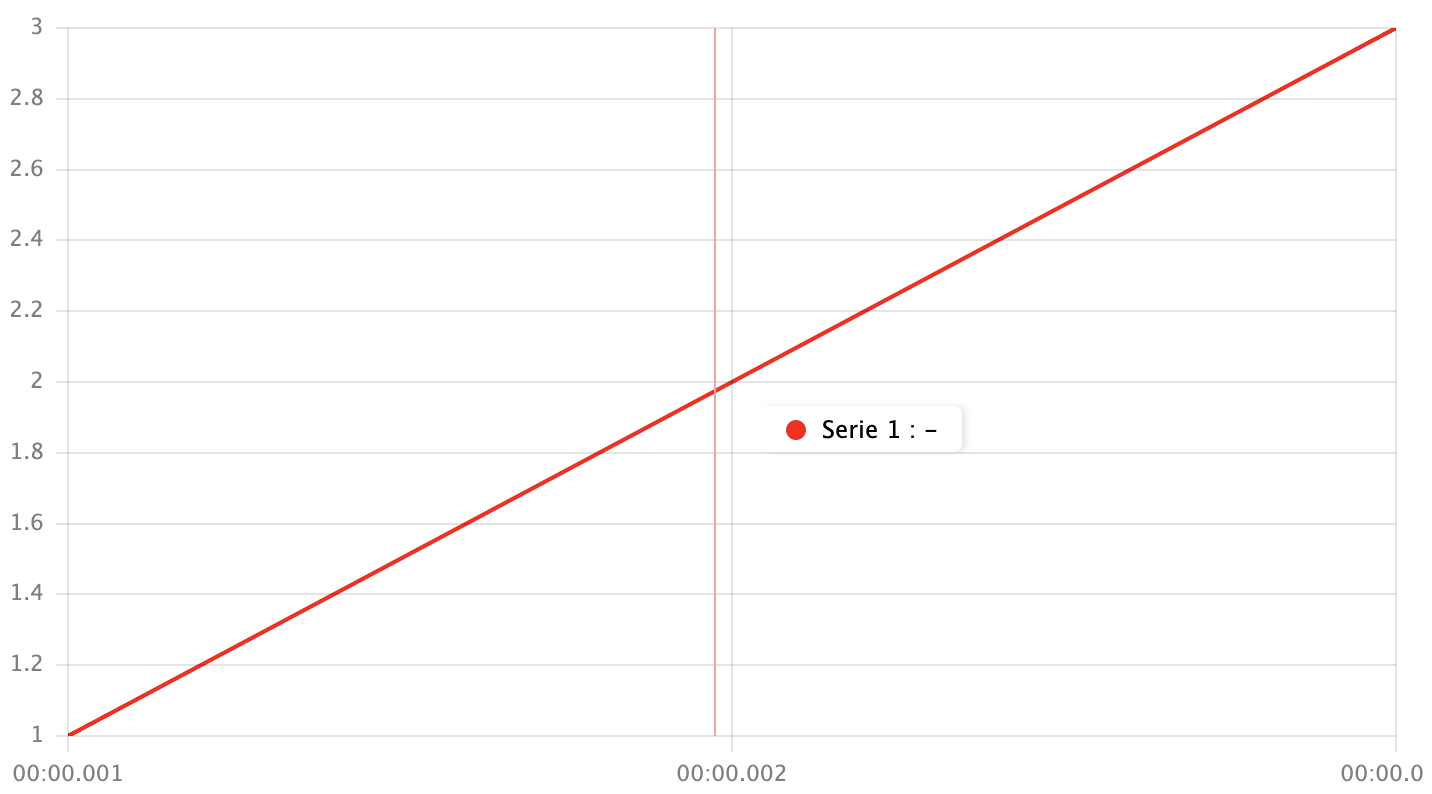
false- don't snap to non-null values
Markers
Cursror markses are elements whish shows Y-values of series on a given cursor X position.
cursor.markersSize?: number- markers radius inpxcursor.maxMarkers?: number- maximum number of markers. If the number of lines >maxMarkers, then markers aren't drawn on chart.
Crosshairs
You can set X and Y crosshairs in the cursor options:
cursor: {
    x: {visible: true, style: '1px solid red'},
    y: {visible: true, style: '1px dash grey'},
},
Hide markers on cursor hover
You can hide markers on cursor hover with cursor.hideMarkers option.
cursor: {
    hideMarkers: (value: number | string | null, seriesIdx: number) => value === 0,
},