Tooltip
Yagr has a default legend tooltip. It has a simple renderer built in, though you can also easily implement your own.
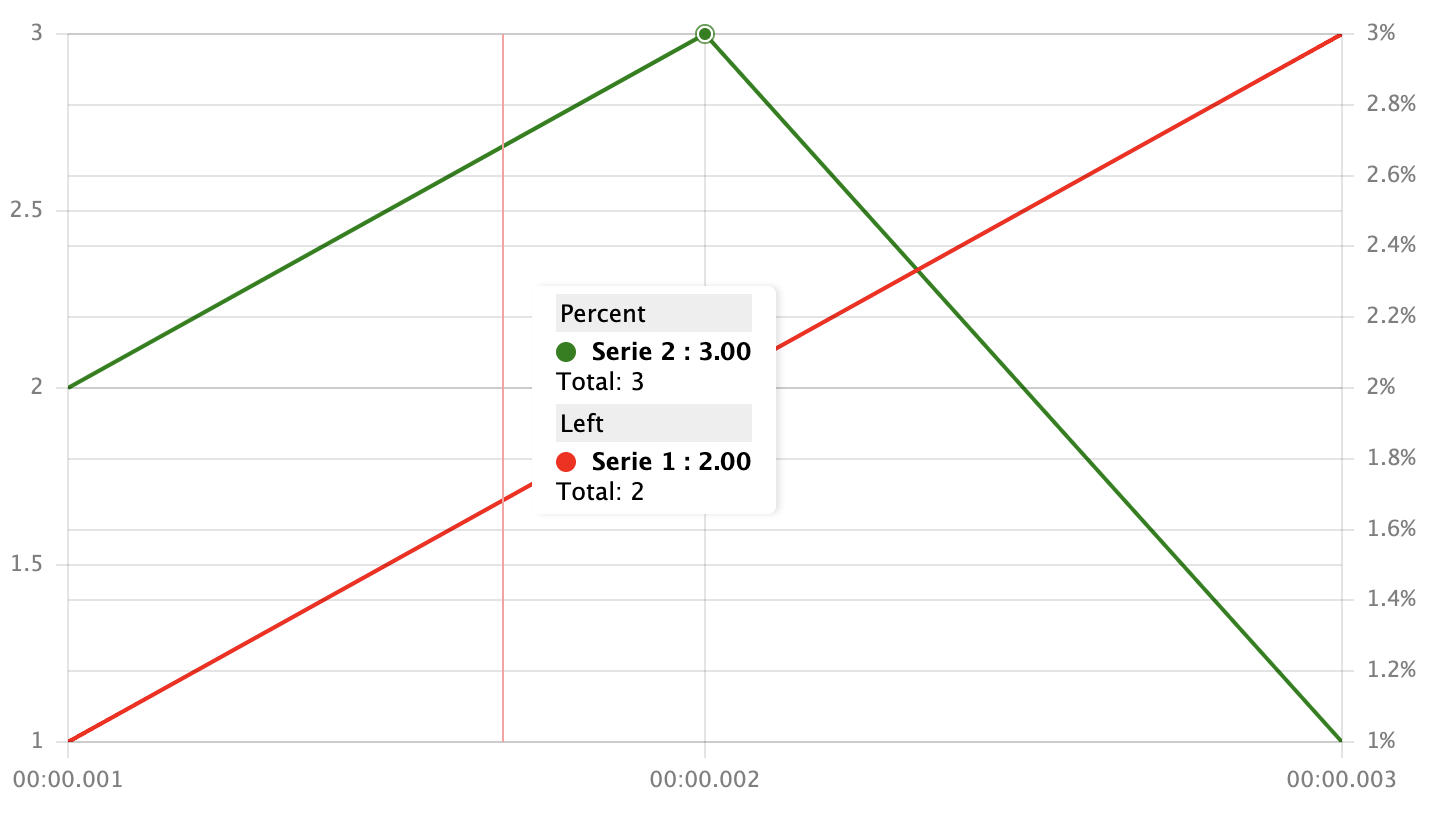
Most tooltip options are the PerScale type, which means that they could be value or {scale: value}. You can see an example of a multi-scale tooltip in this picture:

Configuration for this example:
{
    timeline: [1, 2, 3],
    series: [
        {
            data: [1, 2, 3],
            color: 'red',
        },
        {
            data: [2, 3, 1],
            scale: 'percent',
            color: 'green',
        },
    ],
    tooltip: {
        scales: {
            y: 'Left',
            percent: 'Percent',
        },
    },
    axes: {
        y: {},
        percent: {
            side: 'right',
            values: (u, x) => x.map(i => i + '%'),
        },
    },
    scales: {
        y: {},
        percent: {},
    },
};
Configuration
General
tooltip.show: boolean- enable tooltiptooltip.maxLines: PerScale<number> = 10;- maximum number of lines per scale in the tooltiptooltip.sum: PerScale<boolean> = false- show theSumrow in the tooltiptooltip.sort?: PerScale<SortFn>- row comparatortooltip.pinable: boolean- is tooltip pinabletooltip.strategy: 'pin' | 'all' | 'drag' | 'none'- tooltip strategy.pin- pin tooltip on click only,all- pin both on click and drag,drag- pin tooltip on drag only,none- don't pinhideNoData?: PerScale<boolean>- hide rows if the Y value is equal tonulltooltip.precision?: PerScale<number>- decimals count in numbers when formatting in the tooltiptooltip.value: PerScale<ValueFormatter>- formatter for line valuestooltip.onUpdate: 'none' | 'reset'- how to update tooltip when data is updated.none- do nothing,reset- reset tooltip statetooltip.omitBy: (row: TooltipRow) => boolean- omit row from tooltip if this function returnstrue
type ValueFormatter = (value: string | number | null, precision?: number) => string;
type SortFn = ((s1: TooltipRow, s2: TooltipRow) => number) | undefined;
Tracking
tooltip.highlight: PerScale<boolean>- highlight the active line in the tooltiptooltip.tracking- tracking is a function that calculates the active line index Next available options:
'sticky'- find the closest line index'area'- find the index overlapping the cursor area(y: number, ranges: (number | null | string)[]) => number | null- a custom function that gives the cursor Y value and a list of Y line values Return the active line index or null
Render
tooltip.render: (data: TooltipRenderOptions) => string- tooltip renderer See TooltipRenderOptionstooltip.showIndicies: PerScale<boolean>- show indices in tooltip rowstooltip.percent?: PerScale<boolean>- Not implemented show percentages in tooltip rowstooltip.boundClassName?: string- an CSS selector that finds the element in which the tooltip will be displayed (used only for calculations of offsets, not DOM rendering)tooltip.renderClassName?: string- an CSS selector that finds the element in which the tooltip will be rendered (used only for rendering, not for offset calculations)
Events
Tooltip instance is an EventEmitter, which supports the following events:
init- tooltip was initializedmount- tooltip was mounted into DOMshow- tooltip is shownhide- tooltip is hiddenpin- tooltip is pinnedunpin- tooltip is unpinnedrender- tooltip is rendereddestroy- tooltip is destroyed
Example:
const yagr = new Yagr(...);

yagr.plugins.tooltip.on('show', () => console.log('Tooltip is shown'));
Custom renderer
You can replace the native tooltip renderer with a renderer of your own that accepts the TooltipRenderOptions type.
type TooltipRow = {
    /** Name of DataLine, gets from series.name */
    name?: string;
    /** Current Y value of DataLine */
    value: string | number | null;
    /** Color of DataLine */
    color: string;
    /** Is cursor over DataLine */
    active?: boolean;
    /** Custom className */
    className?: string;
    /** Y Axis value */
    y?: number | null;
    /** Index of series in u.series */
    seriesIdx: number;
    /** Original value before all transormations */
    originalValue?: number | null;
    /** Transformed value  */
    transformed?: number | null | string;
};

interface TooltipSection {
    rows: TooltipRow[];
}

interface TooltipRenderOptions {
    scales: TooltipScale[];
    options: TooltipOptions;
    x: number;
    pinned: boolean;
    yagr: Yagr;
}
Using external non string-to-HTML rendering system (React, Vue, etc)
Tooltip supports virtualization which means that "tooltip' backend" still will work, but tooltip won't render any DOM-elements. This approach allows to use any rendering system you want, just by subscribing to tooltip events. You can find an example of this approach applied to React in the React Tooltip example.
Use tooltip.virtual: true to enable virtualization.
tooltip: {
    virtual: true,
}