Series
Series type adds extra features to uPlot series:
Configuration
Data
-
series.data: (number | string | null)[]- series data -
series.transform?: (val: number | null | string, series: DataSeries[], idx: number) => number | null- series data transformation method -
series.postProcess?: (data: (number | null)[], idx: number, y: Yagr) => (number | null)[];- series data post processing method (will be called if exists after all data transformations)
Name and ID
-
series.name?: string- series name Renders in the tooltip and inline legend. If not this is not passed,Series <series index>name will be generated. -
series.id?: string- series ID, generated automatically if not passed
Appearance
-
series.color?: string- single property to avoid uPlot's fill/stroke for different series types For lines and points, color refers to the stroke color, while it is the fill color for areas and columns. Sets to black if not passed. -
series.width?: number- line width (line type charts) -
series.lineColor? string- line color (area type charts) -
series.lineWidth?: number- line width over area (area type charts) -
series.visible?: boolean;- series visibility
Scale
series.scale?: string- series scale
Visualization
series.type?: ChartType- series visualization typeseries.spanGaps?: boolean- join paths over null-pointsseries.interpolation?: InterpolationSetting- series line interpolation typeseries.cursorOptions?: CursorOptions- series cursor options
Data references
series.max?: number- comes from uPlotseries.min?: number- comes from uPlotseries.avg?: number- calculates before uPlot data will be setseries.sum?: number- calculates before uPlot data will be setseries.count?: number- calculates before uPlot data will be set
Tooltip
-
series.formatter?: (value: string | number | null, serie: Series) => string- formatter for series point values (formatting in tooltip) -
series.showInTooltip?: boolean- show series in tooltip, added to implement more flexible line hiding patterns -
series.precision?: number- series precision in tooltip Used to override axis precision.
Cursor snapToValues override
series.snapToValues?: SnapToValue | false - snap dataIdx value (default: closest) Used to override cursor.snapToValues.
Stacking group
series.stackGroup?: number - stack series group Used to combine series in different stacks. Keep in mind that stacks are just the sum of all real values, and stacks will be calculated wrong if there are data alignment artifacts on a given X-point on some lines. To avoid that, there are special data interpolation options in Yagr (see data alignment for more information). null values in stacks will be interpreted as zeros.
Interpolation
Interpolation of line curves. Don't confuse it with data alignment interpolation
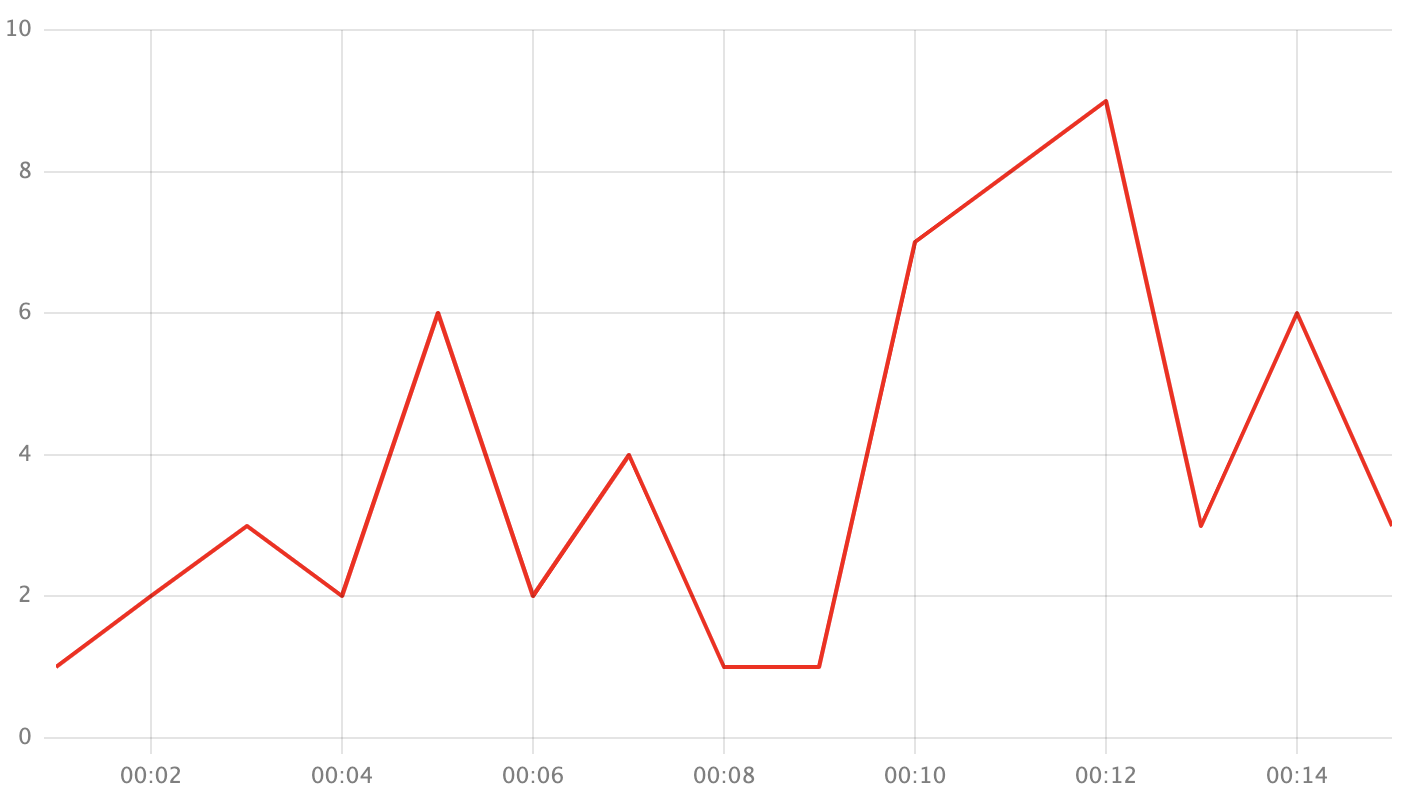
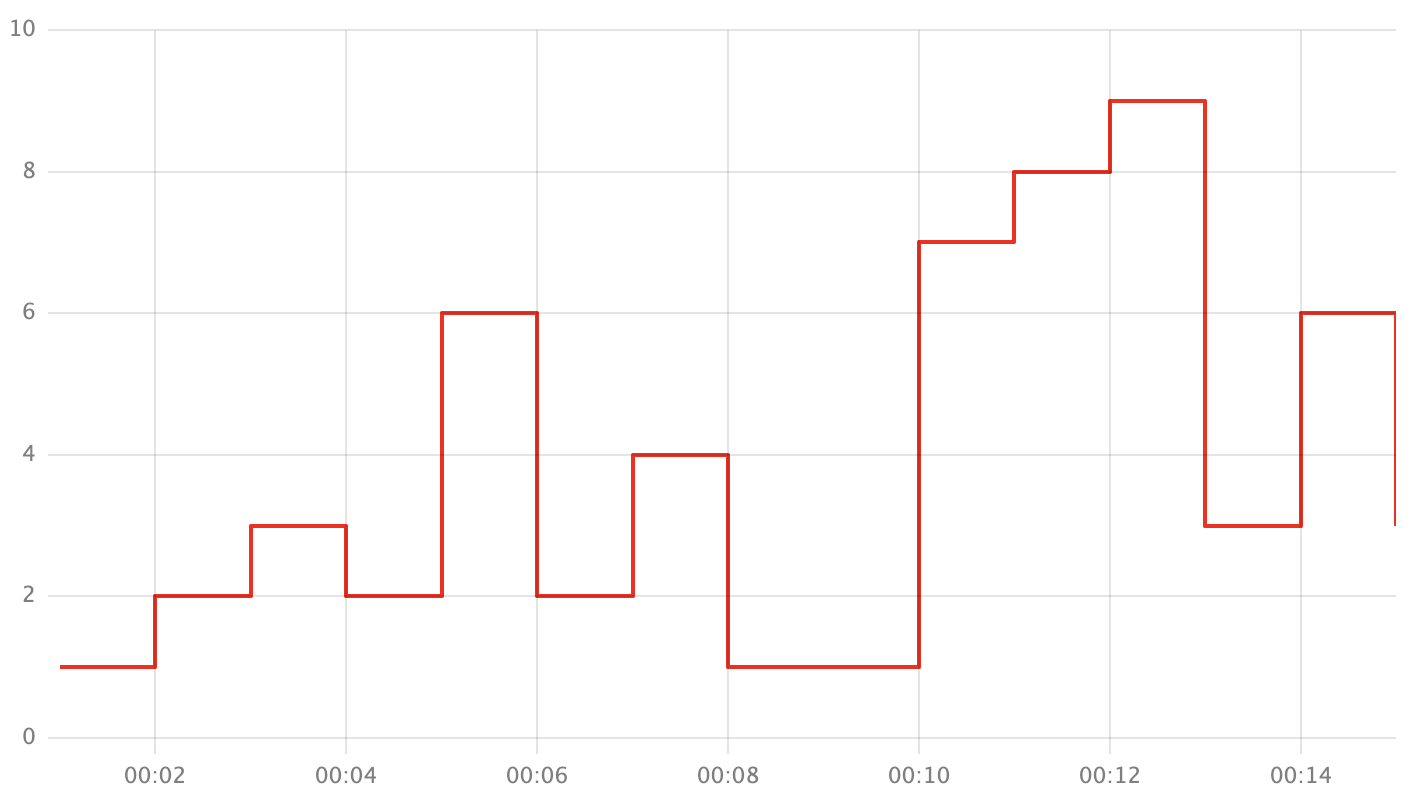
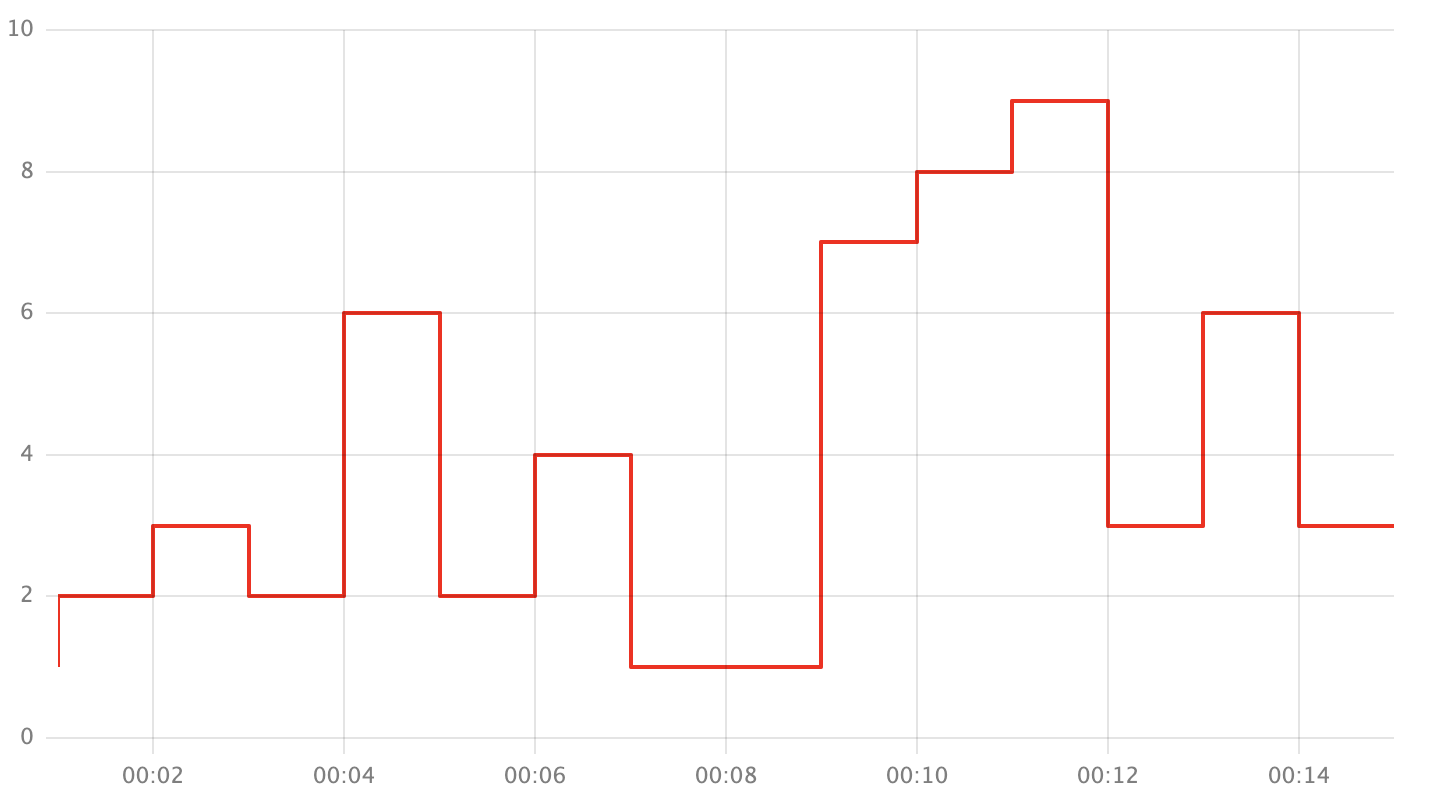
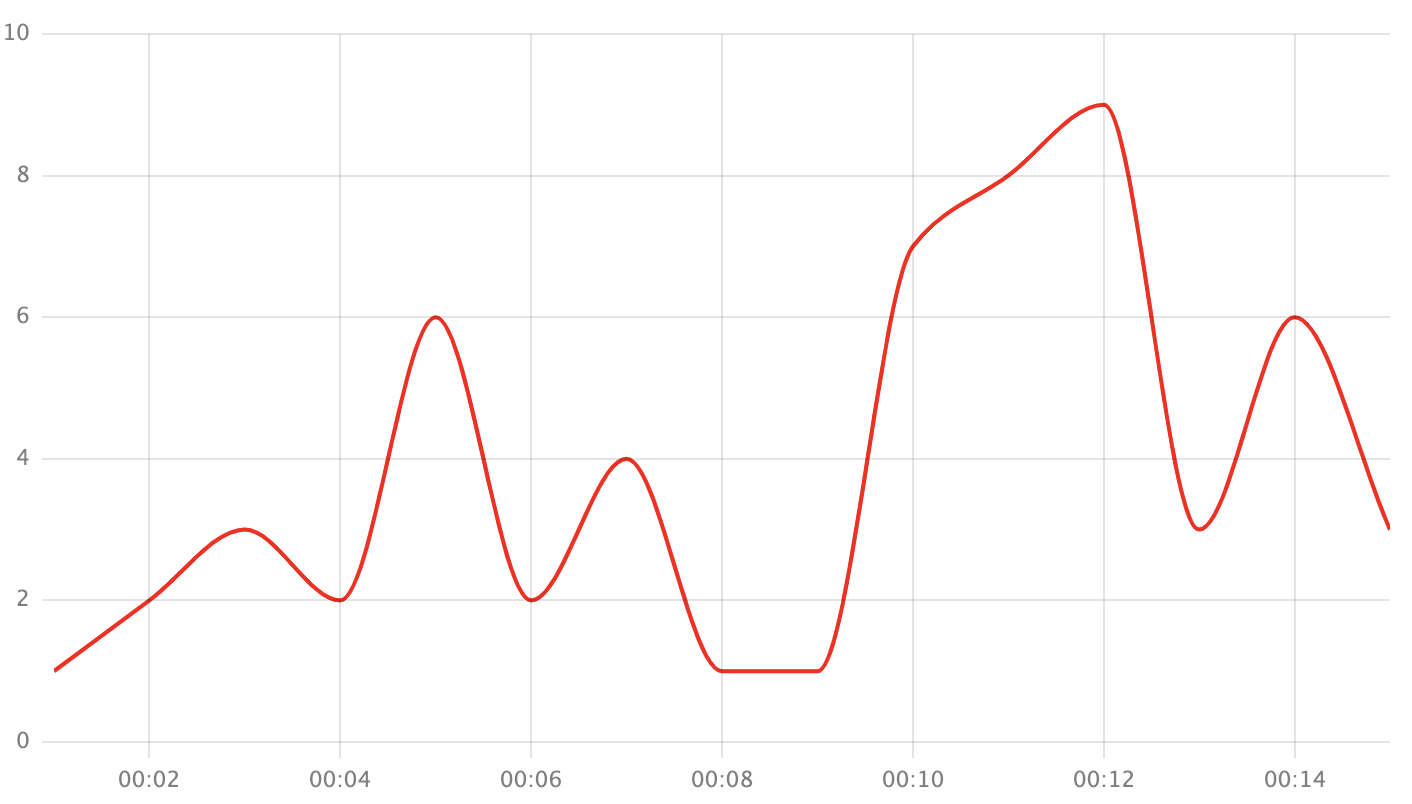
series.interpolation?: InterpolationSetting
type InterpolationType = 'linear' | 'left' | 'right' | 'smooth';
-
linear- linear interpolation

-
left- left interpolation (previous point value)

-
right- right interpolation (next point value)

-
smooth- smooth interpolation (Bezier curve interpolation)
