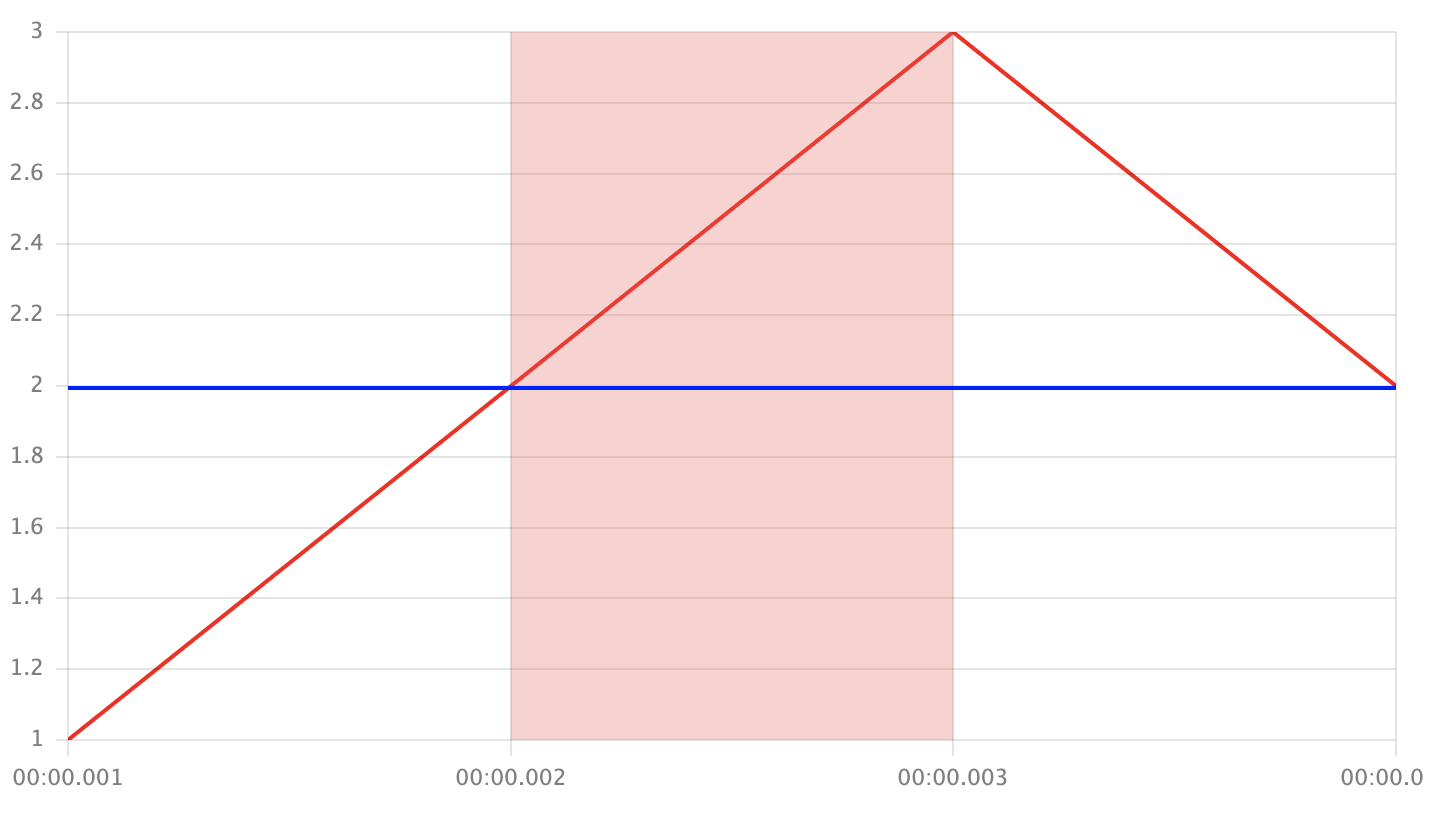
Plot Lines
Plot Lines plugin allows to render custom lines on bands over the chart:

Plot lines are bound to axes which are bound to scales, so to render plot line you should pass it's config to given axis:
// Render vertical band on X axis from X=Now-1s to X=Now
axes: {
    x: {
        plotLines: [{
            value: [Date.now() - 1000, Date.now()],
            color: 'rgba(255, 0, 0, 0.5)',
        }],
    },
}
or
// Render blue horizontal line in width 2px, on the Y=2
axes: {
    y: {
        plotLines: [{
            value: 2,
            color: 'blue',
            width: 2 * devicePixelRatio
        }],
    },
}
By default plot lines drawing over the series and axes, you can choose draw layer in settings.drawOrder
Plot line config
export interface PlotLineConfig {
    /** Value of plotLine or [from, to] on given scale */
    value: number | [number, number];

    /** Color of line */
    color: string;

    /** Line width in px/devicePixelRatio */
    width?: number;
}
Usage with Labels plugin
Labels plugin extends PlotLineConfig type with label property:
axes: {
    y: {
        plotLines: [{
            value: 2,
            color: 'blue',
            width: 2 * devicePixelRatio,
            label: 'My label',
        }],
    },
}